WLX
Type
.wlxin the first line of an input cell
This allows you to use Wolfram Language XML in your cell. It's extremely powerful and especially useful when creating complex cell structures or enhancing them with the power of HTML, CSS, and JavaScript.
Embed Figures into a Custom Layout
Plot a figure into a symbol starting with a capital letter:
Figure = Plot[Sinc[5x], {x, -5, 5}]
Then, in a new cell, type:
.wlx

<div>
  <style>
    @keyframes tilt-shaking {
      0% { transform: rotate(0deg); }
      25% { transform: rotate(5deg); }
      50% { transform: rotate(0deg); }
      75% { transform: rotate(-5deg); }
      100% { transform: rotate(0deg); }
    }
  </style>
  <div style="animation: tilt-shaking 0.35s infinite">
    <Figure/>
  </div>
</div>
Now your plot will shake infinitely! ;)
Creating Components
Let's define a hybrid WL function:
.wlx

Heading[Text_, OptionPattern[]] := With[{color = OptionValue["Color"]},
  <h2 style="color: {color}"><Text/></h2>;
]

Options[Heading] = {"Color" -> "black"}
You can now use it in your layout:
.wlx

<Heading Color={"blue"}>
  Hello World!
</Heading>
Leverage the power of WLX when making Slides.
Use <Escape> tag to escape XML-like expressions:
<Escape>
	<Div>It won't be parsed by WLX</Div>
</Escape>
The inner content will not be parsed and is returned as string
All WL expressions are accessible from within WLX:
.wlx

GetTime := TextString[Now]

<GetTime/>
Two-Column Layout Using Flexbox
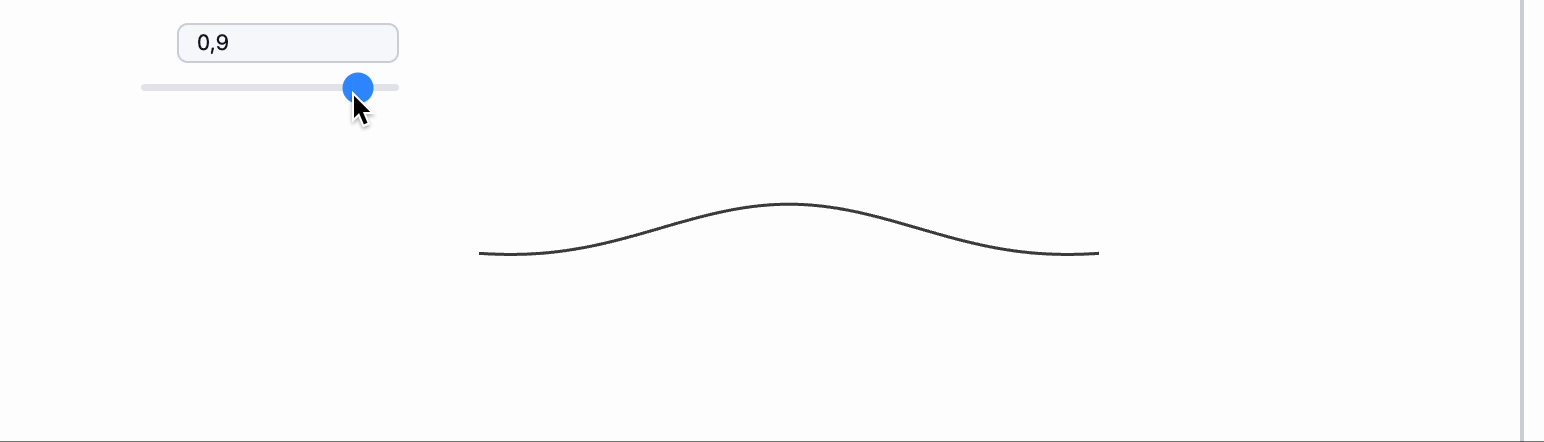
You can fine-tune the layout since you're working directly with HTML and CSS. For example, here's a slider and a plot aligned in a row:
.wlx

Module[{Slider = InputRange[0.1, 1, 0.1, 0.5], Figure, lines},
  EventHandler[Slider, Function[data, lines = {#, Sinc[#/data]} & /@ Range[-5, 5, 0.1]]];
  Slider // EventFire;

  Figure = Graphics[Line[lines // Offload], ImageSize -> 350];

  <div style="display: flex">
    <div><Slider/></div>
    <div><Figure/></div>
  </div>
]